Unless you’ve been living in a bomb shelter, you would’ve seen the explosive growth of infographics over the last few years on the internet. Infographics are popular because they summarize complex information into simple to understand visualizations. It’s no surprise that people prefer to engage with visual content and infographics have become one of the most effective forms of content marketing.

But how does a small business use infographics to get more customers? Today I’m going to present 6 basic steps on how to use infographics to acquire customers. This strategy is designed to achieve two very important goals of internet marketing:
● To draw potential customers directly to your site
● To improve your organic search rankings (or the chances of your site appearing on searches related to your business)
Step 1: Discover a trending topic (and don’t sell)
It’s natural for most small businesses to think about selling their product when they want to create marketing content. They start creating thinly veiled product brochures and then expect people to engage with the content. That is a mistake. Nobody like “hard sell” types of content. Unless you’re a beloved brand like Apple, viewers typically don’t react well to them.
What you need to do is discover an infographic topic that is trending and relevant to your potential customers. Find a topic that helps your potential customers solve a problem or make their lives easier. For example, if you’re a cafe owner, don’t create an infographic about how great your own coffee or pastries are.
Instead, create an infographic on how coffee has health benefits or how people can spice up their drinks with simple recipes or something educational or interesting like the history of cakes in the US.
The trick is to put yourself in your client’s shoes and think about what type of content they would like to see. Search for the phrases you use to describe your category of products. For example, typing in “Coffee and Health” prompts Google to auto-suggest “Coffee and Weight Loss” and a bunch of other interesting topics. Read the articles in the search results and get a sense of what kind of content resonates with people.

If you need more inspiration, hop over to Pinterest and type in the popular terms for your business or check out some content idea generation tools such as Klockwork and Portent.
Step 2: Make a list or Trello board and add your ideas into it
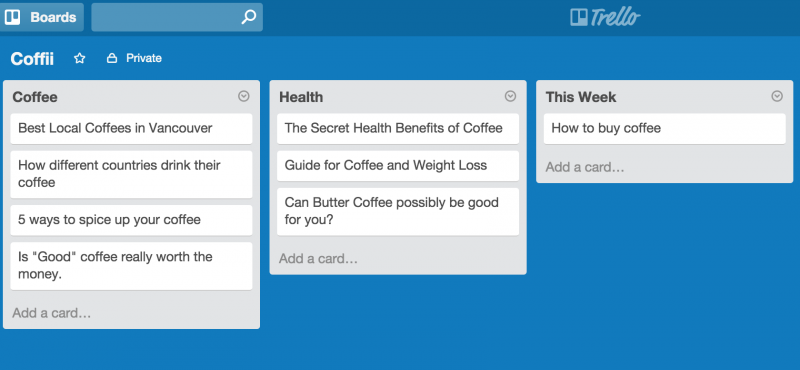
Once your creative juices are flowing, you should put all your ideas into a spreadsheet or a tool like Trello. I personally use Trello to keep all my ideas organized - I categorize my ideas into different lists and also have a “This week” list to track the ideas I’m executing for the week. Why keep them organized? First, you don’t want to forget great ideas you’ve had. Second, you’ll need to have more than one idea to succeed, so creating an easy process to follow will make life easier. More on this later, but for now, keep your ideas in one place. And add more ideas as you get inspired.

Step 3: Create an infographic
Once you’ve settled on a topic, you’ll need to create an infographic. You can hire a designer to do this for you, but be prepared to spend hundreds to thousands of dollars. To do this on a budget, I suggest a DIY approach. The key to this is finding an infographic template you like and customizing it with your own style, copy and images. Not unlike how you would create a Powerpoint presentation from one of their ready-made templates. I’ve written a bit more about how to create infographics here.
There are also plenty of free infographic tools out there. Just do a Google search and you’ll find a list of the most popular ones. Most of these tools have charts and visuals that you can drag and drop into an editor to create your own design.
Step 4: Add a call to action to your infographic
This is one step that most content creators forget. If you want viewers to come to your site, you have to ask them to do it. If you’ve posted your infographic on social media, many times, people will just view the content there and never click back to your site. I usually recommend two types of call to actions. One is a call to action to a specific article or resource where the viewer can learn more about what they just saw. Another is a call to action to sign up for a newsletter for similar types of content. Why ask for email signups? Email newsletters are the best way to convert viewers to customers for many businesses.
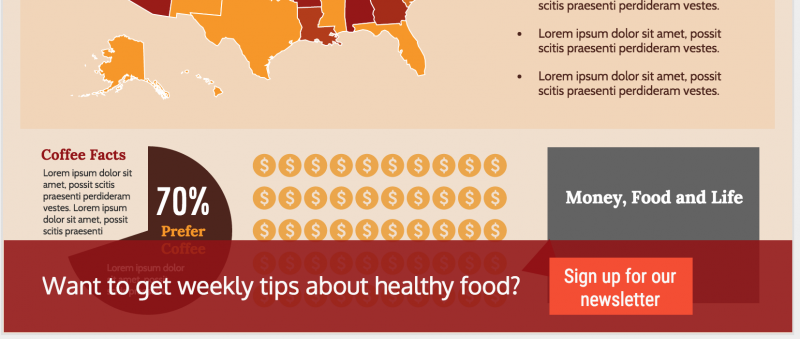
Using the same cafe owner example, you could add a “Want to learn more about healthy food? Sign up for our newsletter” call to action with a link to subscribe to your email newsletter.

Step 5: Find other people to re-post the content
After you’ve created your infographic, you need to find people who would be interested in it to repost it. Why? Because unless you already have a large audience, posting the infographic on your own marketing channels will not be enough. You will need to expand your reach to get new customers. The best way to do this is to find bloggers who post content related to your business and pitch them your infographic.
First, do a search for the Top X Blogs (X being your business category)

Read the articles, pick a few smaller or niche site bloggers and send them an email, offering your infographic to them. The best way to send a cold email to a blogger is to use a “feeler” email first, as outlined in this post. If they respond, you’ll follow up with the infographic and offer to write an introduction on the post.
Step 6: Rinse and repeat
What? You got to keep doing this? No magic tricks? Nope. Marketing with infographics or any other medium isn’t a one off trick. You need to be consistent. Just like writing a blog. You can’t get tons of traffic with one article. That’s why Step 2 is all about organizing your ideas. You will execute one idea at a time at a frequency that suits you. But success will only come if do it consistently and if you learn to do it well.
This is hard work but it pays off in the long run because each post you get extends your audience. You’ll begin to develop relationships with the bloggers you’ve reached out to and they’ll write more content about you. And as a result, your content becomes more discoverable and that increases your traffic and new customers.
Happy infographicing!
About the Author

Eugene Woo is the co-founder of Venngage, a free infographic maker. He is a software developer and entrepreneur, focusing on content marketing, data visualization and data science. You can read more of his articles on the Venngage blog. Follow him on Twitter @wooyi.


