


coffee shop and coffee manufacturing industry overview
This industry overview will discuss the latest statistics and trends for those interested in the coffee business.
- Limited-service eating places: In Canada, this is the industry category for coffee shops. In this category, food and drinks are paid for prior to consumption and typically picked up at the counter to eat at the retail location or as takeout.
- Snack and Non-alcoholic Beverage Bars: In the US, this is the coffee shop industry category; do not confuse this with limited-service restaurants, which excludes coffee shops.
- Coffee and Tea Manufacturing: This is the industry category for coffee roasters and tea blenders. This has been included as some independent coffee shops roast their own coffee beans.
For more specific information about researching the coffee shop industry, please see our Coffee Shops and Coffee Manufacturing Guide. For an overview of the overall Restaurant industry, please see our Restaurant Industry Overview.
For information about related industries please see our industry guides for restaurants, caterers, bakeries, specialty foods, and street food vendors.
Industry Status
Industry phase: Mature
Concentration: Medium
Competition: High
Regulation: Medium and Increasing
(Sayler, 2018; Ozelkan, 2018)
Starting a coffee shop has a low barrier to entry due to the lower amount of capital required to start a business.
Coffee roasting has a very high barrier to entry; but if you are not planning to sell your roasted coffee on the mass market in places such as grocery stores, this barrier is significantly lower (Ozelkan, 2018).
BC Industry Snapshot
- Overall profit margin for limited-service eating places is around 5% (Statistics Canada)
- Sales were up by 8.0% in British Columbia in the third quarter in food services and drinking places (Statistics Canada)
- High rental costs are increasing the barrier to entry for new coffee shop owners (Sagan, 2019)
- Only Ontario and BC have significant coffee and tea manufacturing industries in Canada (Statistics Canada)
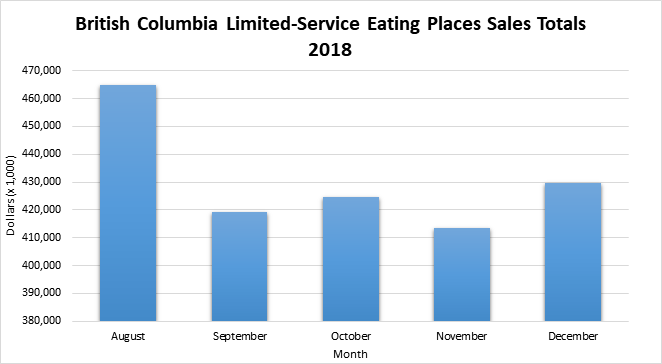
Statistics Canada. Table 21-10-0019-01 Monthly survey of food services and drinking places (x 1,000)
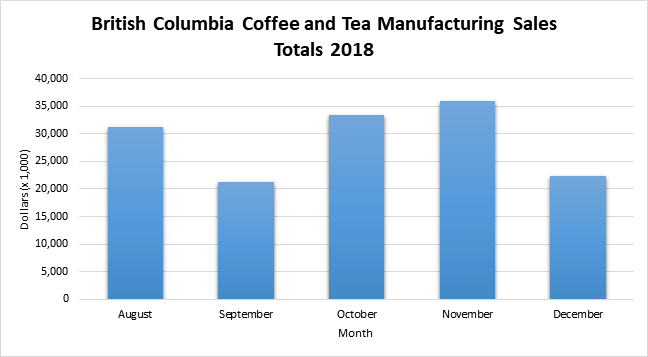
Statistics Canada. Table 16-10-0048-01 Manufacturing sales by industry and province, monthly (dollars unless otherwise noted) (x 1,000)
Employment Numbers
Most limited-service eating places and coffee and tea manufacturing companies in British Columbia have fewer than 50 employees, as shown in the charts below.
Limited-service eating places encompasses eating places beyond coffee shops, but most are not large chains, contributing to the high competition in the industry. There are fewer coffee and tea manufacturing companies, and they tend have no employees because of the local and small markets they serve as well as the high barriers to entry.
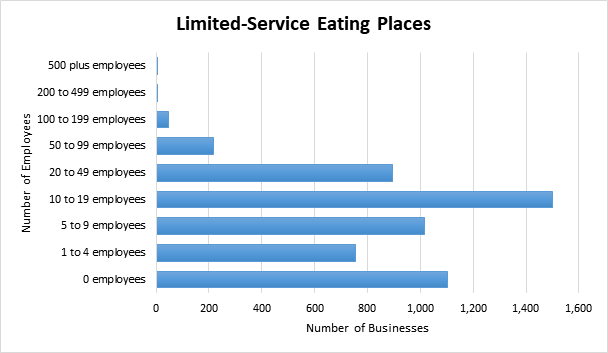
Statistics Canada. Table 33-10-0092-01 Canadian Business Counts, with employees, June 2018; Table 33-10-0094-01 Canadian Business Counts, without employees, June 2018
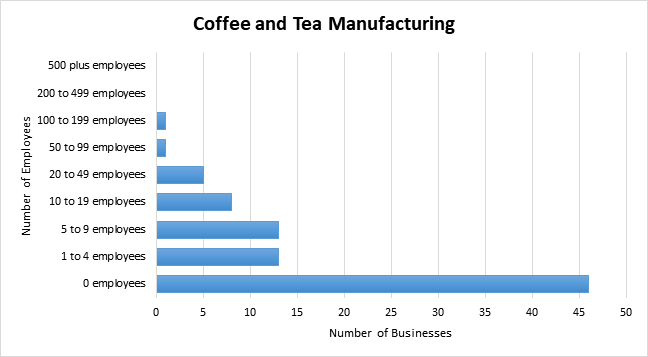
Statistics Canada. Table 33-10-0092-01 Canadian Business Counts, with employees, June 2018; Table 33-10-0094-01 Canadian Business Counts, without employees, June 2018
Industry Trends and Challenges
Continuing Growth
Both coffee shops and coffee and tea production will see their growth trend of the past five years continue, at a slightly slower rate than previously. The growth rate is being negatively impacted by economic stagnation and a stronger Canadian dollar (Sayler, 2018; Ozelkan, 2018).
- Coffee shops are expected to grow at an annualized rate of 3.1% (Sayler, 2018)
- Coffee and tea production expected to grow at an annualized rate of 2.1% (Ozelkan, 2018)
Canada is one of the largest consumers of coffee in the world (the conversation), with 82% of Canadians drink coffee every week (Coffee Association of Canada, 2018).
Climate Change
In coffee and tea production, low harvest yields have resulted in more expensive coffee beans and tea leaves (Ozelkan, 2018). It is expected that many of the areas in which coffee is grown will no longer be able to grow coffee due to climate change (Charlebois, 2018).
Third-Wave Coffee
An increasing number of consumers are purchasing specialty coffee, in which the coffee is considered an artisanal product and is analyzed in a similar way to wine (Draper, 2019); the focus is on offering consumers a particular experience with a product (Schalk, 2018).
This segment has grown over the past five years (Sayler, 2018), and it now represents about 60% of coffee consumed in the US (First Research Industry Profile, 2018). Offering specialty coffee that cannot be obtained in other shops also provides small coffee shops with a competitive advantage over large chains (First Research Industry Profile, 2018).
Canadian Revenue Spending Breakdown
These charts show how revenue in both limited-service eating places and coffee and tea manufacturing is spent. Overall, 67.9% of limited-service eating places and 69.0% of coffee and tea manufacturing businesses are profitable (Statistics Canada, 2018).
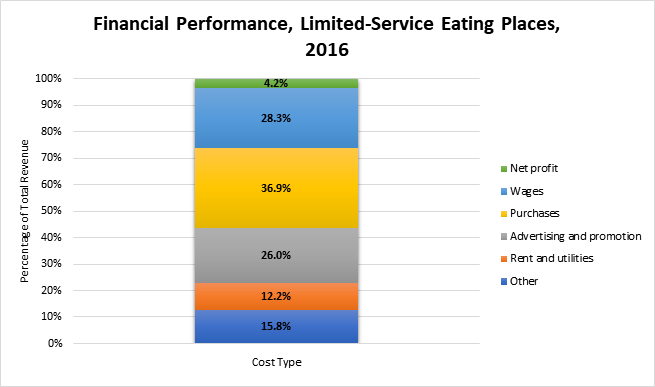
Statistics Canada. (2018). Report for: NAICS 722512 - Limited-service eating places - Financial Performance Data.
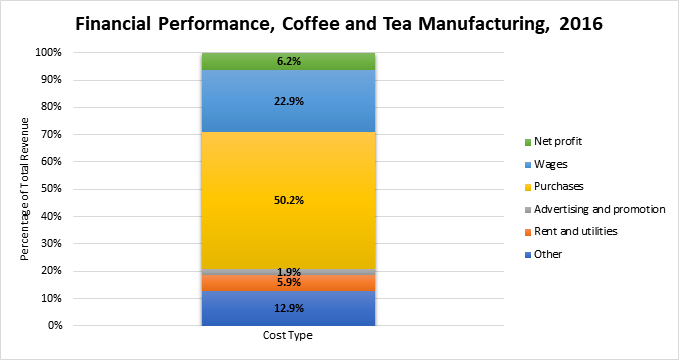
Statistics Canada. (2018). Report for: NAICS 311920 - Coffee and Tea Manufacturing - Financial Performance Data
Bibliography
Charlebois, Sylvain. (2018). How the coffee industry is about to get roasted by climate change. The Conversation. Retrieved from https://theconversation.com/how-the-coffee-industry-is-about-to-get-roasted-by-climate-change-85054
Coffee Association of Canada. (2018). Canadian coffee drinking study – 2018 infographic. Retrieved from http://www.coffeeassoc.com/media-coffee-facts/
Draper, James. (2019). From the grounds up: Coffee aficionado works to perfect craft. Longview News Journal. Retrieved from https://www.news-journal.com/features/taste/from-the-grounds-up-coffee-…
First Research Industry Profile. (2018). Coffee shops - quarterly update 11/19/2018. Fort Mill, South Carolina: Mergent. Retrieved from Business Market Research Collection
First Research Industry Profile. (2018). Coffee & tea manufacturing - quarterly update 11/19/2018. Fort Mill, South Carolina: Mergent. Retrieved from Business Market Research Collection
Sayler, B (2017). Coffee and snack shops in Canada (IBISWorld Industry Report 72221bCA). Retrieved from IBISWorld Inc.
Ozelkan, E. (2018). Coffee and tea production in Canada (IBISWorld Industry Report 31192CA). Retrieved from IBISWorld Inc.
Sagan, Aleksandra. (2019). Tiny coffeeshops help owners save on rent in high-cost Toronto, Vancouver. CTV News Vancouver. Retrieved from https://bc.ctvnews.ca/tiny-coffeeshops-help-owners-save-on-rent-in-high-cost-toronto-vancouver-1.4251127
Schalk, Danielle. (2018). The 2018 coffee and tea report. Food Service and Hospitality. Retrieved from https://www.foodserviceandhospitality.com/the-coffee-and-tea-report/
Statistics Canada. (2018). Report for: NAICS 311920 - coffee and tea manufacturing - financial performance data. Small business profiles, 2016. Retrieved from https://www.ic.gc.ca/app/sme-pme/bnchmrkngtl/rprt-flw.pub?execution=e1s2
Statistics Canada. (2018). Report for: NAICS 722512 - limited-service eating places - financial performance data. Small business profiles, 2016. Retrieved from https://www.ic.gc.ca/app/sme-pme/bnchmrkngtl/rprt-flw.pub?execution=e1s2
Statistics Canada. (2017). Table 21-10-0171-01 Food services and drinking places, summary statistics. Retrieved from https://www150.statcan.gc.ca/t1/tbl1/en/tv.action?pid=2110017101
Statistics Canada. (2018). Table 16-10-0048-01 Manufacturing sales by industry and province, monthly (dollars unless otherwise noted) (x 1,000). Retrieved from https://www150.statcan.gc.ca/t1/tbl1/en/tv.action?pid=2110001901
Statistics Canada. (2018). Table 21-10-0019-01 Monthly survey of food services and drinking places (x 1,000). Retrieved from https://www150.statcan.gc.ca/t1/tbl1/en/tv.action?pid=2110001901
Statistics Canada. (2018). Table 33-10-0092-01 Canadian Business Counts, with employees, June 2018. Retrieved from https://www150.statcan.gc.ca/t1/tbl1/en/tv.action?pid=3310009201
Statistics Canada. (2018). Table 33-10-0094-01 Canadian Business Counts, without employees, June 2018 Retrieved from https://www150.statcan.gc.ca/t1/tbl1/en/tv.action?pid=3310009401
Comments
Thanks
This is a really great layout and incredibly useful!
I would certainly appreciate a similar article by province (BC, ON, QC at least) because reading the stats can report generator is nowhere near as easy as the table you provided! Thanks for the great work!!
PERFECT START
Thanks so much for this. This is exactly what I was looking for and a perfect place to start with some really great current and Canadian sources to help build off of !!!